Subscribe to receive the latest blog posts to your inbox every week.
By subscribing you agree to with our Privacy Policy.
Most onboarding teams measure volume.
Fewer measure quality well.
Applications received, cases processed, and approvals completed are useful numbers. But they do not tell banks or NBFCs whether the onboarding workflow is actually getting better.
That requires a different question:
How should you measure onboarding quality in BFSI?
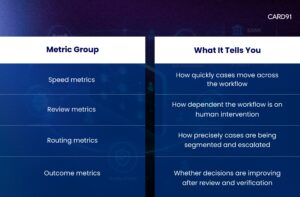
To measure onboarding quality in BFSI, banks and NBFCs should track metrics that show speed, review dependency, routing precision, clarification burden, exception quality, and decision outcomes. The goal is not just to count cases, but to understand how well the workflow converts verification into reliable next-step action.
That matters because onboarding quality is not just about processing more.
It is about processing better.
A team can improve throughput and still have a weak onboarding workflow.
For example:
This is why onboarding quality should be measured as a workflow outcome, not just an ops count.
That logic also connects to What Should Trigger Manual Review in BFSI Onboarding? A Practical Decision Framework.
This makes the workflow easier to assess as a system rather than as disconnected reporting.
This measures the share of cases that move from input capture to next-step action without manual review.
Why it matters:
It shows whether the workflow can convert completed checks into action with minimal intervention.
This measures the percentage of cases that enter manual review.
Why it matters:
It shows how dependent the workflow still is on human intervention.
This metric becomes more useful when read alongside manual review dependency in BFSI onboarding.
This measures how often cases need more information or another check before they can move forward.
Why it matters:
It helps teams understand whether the workflow is collecting the right inputs up front and whether incomplete cases are being routed properly instead of pushed into review.
This measures how many reviewed cases are eventually approved.
Why it matters:
If too many reviewed cases are later approved, the workflow may be sending too many low-friction cases into review.
This measures whether cases entering exception queues are actually the right ones.
Why it matters:
A strong exception queue should contain cases with real inconsistency, elevated sensitivity, or meaningful decision ambiguity — not broad uncertainty caused by weak routing.
If exception queues are filled with low-friction or recoverable cases, the workflow is escalating too widely and using reviewer time inefficiently.
This is where risk-aligned onboarding flow design becomes measurable in practice.
This measures time-to-decision across different paths:
Why it matters:
Average turnaround time alone can hide workflow problems. Route-level measurement shows where the delay actually sits.
This measures whether decisions made after review are consistent and reliable over time.
Why it matters:
Manual review should improve decision quality, not just slow the workflow.
Stronger teams do not use these metrics in isolation.
They read them together.
For example:
That is why onboarding quality should be measured as a connected operating system, not as disconnected reporting.
This is also consistent with the shift toward post-verification decisioning in BFSI onboarding.
Many onboarding delays are caused by low clarity, not just high risk.
That is why teams should not measure only approval and rejection.
They should also measure how well the workflow distinguishes:
This is where confidence scoring in BFSI onboarding becomes operationally useful.
CARD91’s onboarding direction is built around improving how cases move after checks are complete.
Across verification intelligence in onboarding, post-verification decisioning, confidence scoring, and risk-aligned onboarding flow design, the focus is consistent: reduce avoidable review dependency, improve routing precision, and make onboarding decisions more reliable.
That is where VerifyIQ fits naturally — helping teams turn fragmented verification outputs into clearer onboarding action.
You do not improve onboarding quality by counting more.
You improve it by measuring what actually affects speed, control, and decision precision.
That is what turns onboarding metrics into operational value.
CTA: Book a VerifyIQ demo
Q: How should banks measure onboarding quality?
A: Banks should measure onboarding quality using workflow metrics such as straight-through rate, manual review rate, clarification rate, route-level turnaround time, and approval quality after review.
Q: What is the most important onboarding metric in BFSI?
A: There is no single metric. Straight-through rate, review rate, and turnaround time by route are often the most useful together.
Q: Why is manual review rate important?
A: Because it shows how dependent the workflow still is on human intervention and whether too many cases are being escalated unnecessarily.
Q: What does a high review-to-approval ratio mean?
A: It often means too many low-friction cases are being sent into review instead of being routed more clearly upstream.
Q: Why should onboarding metrics be measured together?
A: Because one metric alone can be misleading. Workflow quality becomes clearer when speed, review dependency, routing precision, and decision outcomes are assessed together.


To know more about our offerings connect with our experts


Sales: sales@card91.io
HR: careers@card91.io
Media: comms@card91.io
Support: support@card91.io